Latency and loss
Continuous ICMP or TCP measurements. Unavailable samples and packet loss remain explicit.
 RTTy
RTTynetwork monitoring / macOS 26+ / iOS + iPadOS 17+
RTTy is a native Apple-platform application for inspecting current network behavior and recent measurement history. Mac provides the full dashboard and menu bar. The iPhone and iPad companion, which adds local-first health observations with optional Nearby snapshots from a paired Mac, is in development.
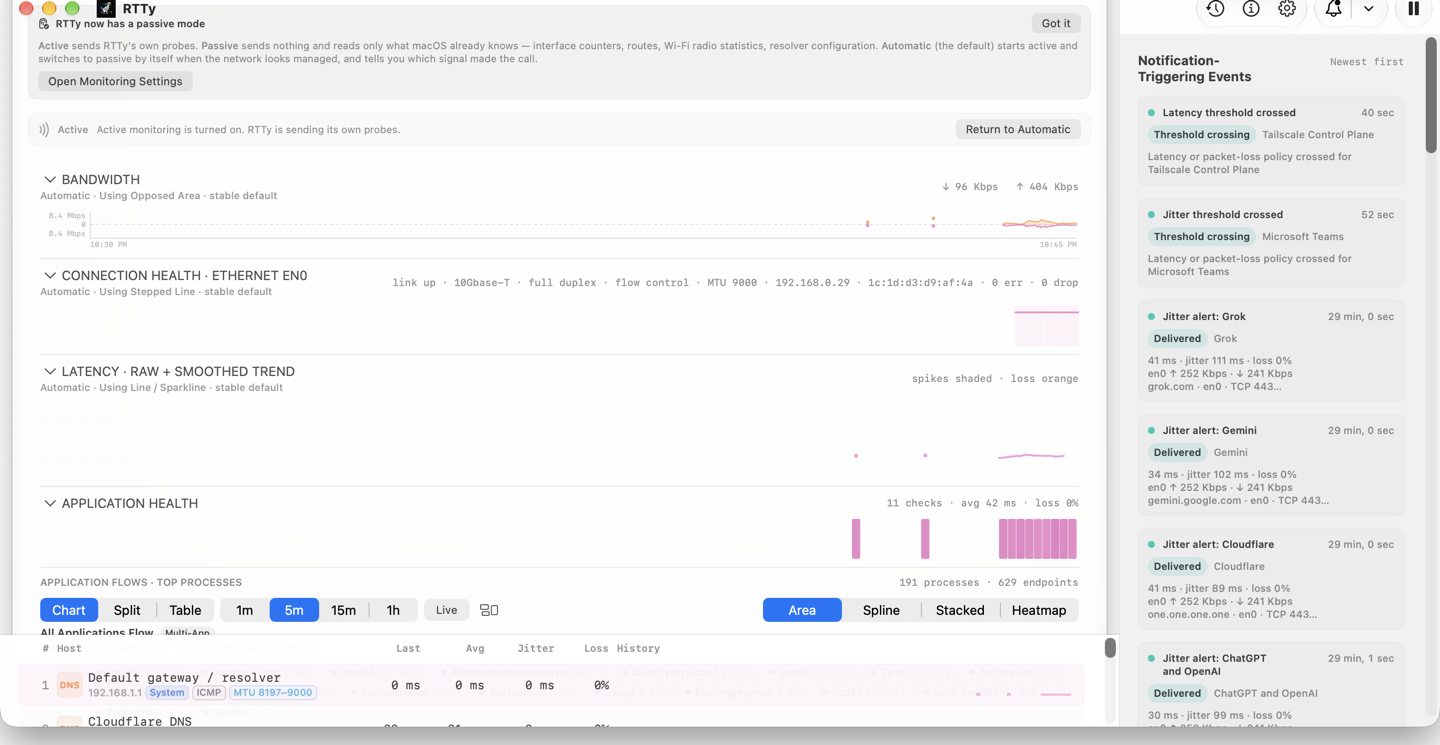
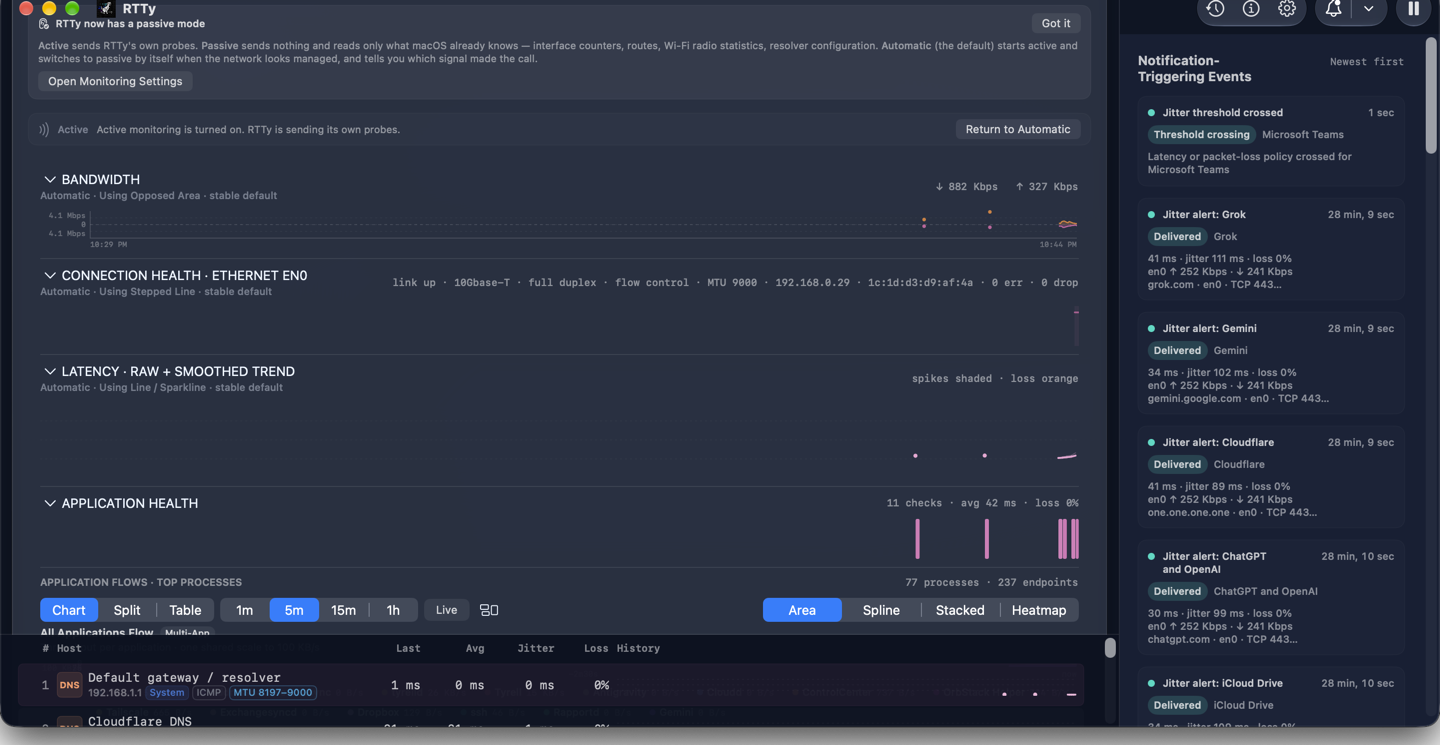
current macOS interface
measurement model
Charts share the same time range. Color indicates relative severity; orange is reserved for explicit loss.
Continuous ICMP or TCP measurements. Unavailable samples and packet loss remain explicit.
Current upload and download rates with recent history in the dashboard and menu bar.
Active interface, route, DNS, MTU, Wi-Fi signal, and relevant path changes.
Optional checks for configured services, kept separate from general network latency.
chart behavior
01Every latency chart sizes its time slices from the observed probe cadence, so the line stays continuous at any probe interval and across a span switch, instead of breaking into empty slots when probing slows down.
02A timed-out probe is still a sample. Measured packet loss keeps its time slot as a full-height marker rather than disappearing from the history.
03A gap in a chart means monitoring actually stopped. RTTy does not draw across an outage to keep a line tidy.
application flows / direct build
01The flows plot is edge-aligned with the bandwidth chart above it, so a moment in one chart sits at the same horizontal position in the other.
02The legend sits below the chart and wraps onto further rows, so no application is hidden past a fold.
03The time axis slides continuously rather than advancing one bucket at a time, and a Live toggle pins a 60-second window.
04Helper, XPC, and Electron child processes are grouped under the application that owns them and drawn in shades of that application’s own hue. A Grouped or Every-process control switches between the grouped view and unattributed per-process rates.
05The menu bar can draw the same thing: an Application flows chart kind puts one line per application in the status item, in the colors the dashboard uses for them.
06Per-application flows, including the menu-bar chart above, are part of the Direct build only.
monitoring modes
RTTy measures your network without assuming it is welcome to. In Active mode it sends its own latency probes, path-MTU checks and speed tests — the full diagnostic picture. In Passive mode it sends nothing at all, and reads only what macOS already knows: interface byte counters, routes, Wi-Fi radio statistics, DNS configuration, and, in the Direct build, per-app socket activity.
Automatic, the default, starts active and switches itself to passive when the network looks managed — enterprise Wi-Fi, a configured proxy or PAC file, a corporate VPN, or filtered ICMP — and tells you which observation made the call. One click forces passive; one click hands the decision back. Whatever RTTy stops measuring, it says so, rather than showing you a zero.
For corporate networks: forced passive mode exists for people whose IT policy forbids probing. Choose Passive and RTTy originates nothing for as long as it is selected, and a mode you choose yourself is never overridden by detection.
appearance and settings
Each theme resolves to a measured palette — board, panels, separators, text, gridlines, and the series colors used for application flows — rather than to the system’s default grays.
Follows the Mac's own light and dark switch. Its dark side is Space Blue.
Light, Dark, True Black, and Space Blue are each selectable by name.
Appearance, Monitoring, Menu Bar, History and Sync, and Advanced.
Less-used controls sit behind collapsed disclosures. Nothing was removed; a test counts the controls so a deletion fails rather than quietly vanishing from a pane.
system requirements
RTTy supports macOS 26 or later and iOS or iPadOS 17 or later. The Mac application ships as a universal binary and runs natively on both Apple Silicon and Intel Macs.
01Both Mac builds measure round-trip time the same way: real IPv4 ICMP echo, with an explicitly labeled TCP fallback when ICMP goes unanswered. The Mac App Store build does this inside the App Sandbox, through reviewed public APIs, with no helper and no elevated privilege.
02The Direct build adds three things the Mac App Store build does not have today: per-application flows, the menu-bar per-application chart, and IPv4 path-MTU discovery.
03Route and resolver evidence, TCP service checks, and local interface counters are in both builds. Whatever a build cannot perform is shown as an explicit unsupported state rather than as a zero.
04The two Mac builds carry separate bundle identities, so they do not share preferences, permissions, or measurement history.
05The iPhone and iPad companion and the Apple TV wallboard are in development; neither is offered for download here.
interface examples
01The default macOS status item puts latency on the first line and a fixed-width download/upload readout beneath it.
02The dropdown separates Combined, Latency, Bandwidth, and Applications views.
03Bandwidth, latency, connection, and Application Health charts resolve only to geometries their data supports.
Review the technical examples →data handling
01Mac measurements and history remain local unless you explicitly export or enable Nearby sharing.
02iPhone and iPad perform bounded local path and service probes while active; a paired Mac is optional enrichment, not a prerequisite.
03Optional private iCloud sync keeps settings and a per-device health projection in your own iCloud account; it is off until you enable it and never reaches the developer.
04Missing observations remain missing; RTTy does not fill gaps with estimated values.
05This site does not use marketing analytics.
compatibility and support
Support, privacy, and diagnostic-reporting guidance are collected here, along with the compatibility statement above.